Blank Map of California
By Marko Visic · Updated Nov 11, 2026
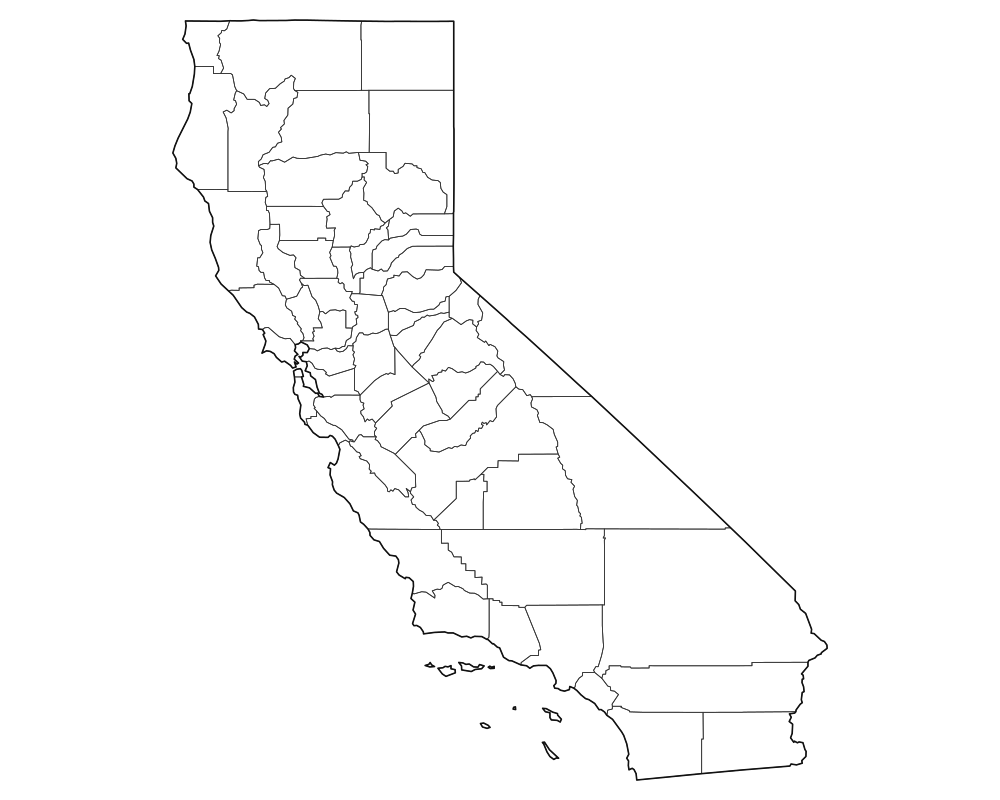
Free printable map of California with 58 counties in four variants (blank, labeled, colored and with cities), as SVG, PNG or PDF.
About this blank map of California
This is a free, high-resolution blank map of California, showing 58 counties. It is drawn from public-domain boundary data (the US Census Bureau’s 2017 cartographic boundaries, via the us-atlas project) and exported as a clean vector file with no watermark and no signup.
California is home to about 39.4 million people (US Census Bureau, Vintage 2025 estimate for July 1, 2025) and covers 155,860 mi² of land (403,677 km²). The capital is Sacramento.
The blank, labeled and colored variants are drawn from the same geometry, so their borders line up. Download the blank version for student worksheets and print the labeled version as the answer key.
California factsheet
Sources: US Census Bureau (population, Vintage 2025 estimate for July 1, 2025; land area, 2026 Gazetteer; largest city, Vintage 2025 city estimates); electoral votes, the 2024 and 2028 allocation (National Archives).
The 4 variants explained
Every map comes in four versions, and each one downloads as SVG, PNG or PDF.
1. Blank outline
The basic outline: every county is a separate path with no fill and a thin border. Use it for quizzes, fill-in-the-blank exercises, or as a base for your own data.
2. Labeled
The same outline with each county’s name at its center. Names are sized and placed automatically, and long names are shortened to fit. Use it as the answer key, or as a reference when you don't want to add labels yourself.
3. Colored
Each county gets one of 12 pastel colors in turn, so the colors mean nothing and two neighbors can share a color. Use it when you want a colored map without doing the coloring yourself.
4. With cities
The outline plus dots and labels for the largest places in the state, using the place names the US Postal Service gives its ZIP codes, ranked by population from SimpleMaps’ free US ZIP data (CC BY 4.0). Use it for travel projects, or whenever readers need landmarks to find places.
What people use blank maps of California for
K-12 and university teaching
Geography, history, civics, and political science teachers use blank maps of California for in-class quizzes ("label the counties"), homework worksheets, and unit-assessment answer keys. The blank/labeled pair lets you print the worksheet and the key from the same source so the answers fit exactly where the student wrote.
YouTube and content creation
Explainer-channel creators use the colored or with-cities variant as a base layer in After Effects, DaVinci Resolve, or Premiere. Because the SVG is fully vector, you can scale it up to 4K with no pixelation, and animate individual counties by targeting their paths.
Sales and marketing territory mapping
Small businesses use blank maps to plan delivery zones, sales territories, franchise locations, or store coverage. Open the SVG in Figma or Illustrator, drop a colored fill on the relevant counties, add pins for office locations, and you have a board-ready territory map in minutes.
Data visualization and choropleths
Data journalists and analysts use the blank SVG as the geometry layer for choropleth maps. Each county is its own path, so you can color it by population, income, election results or any other measure in D3, Observable or Datawrapper. The paths carry no ID codes, so you match them to your data by name.
Travel scrapbooks and bucket lists
Travelers print a blank map of California and color in each county they visit, which turns the map into a souvenir poster without an app or a subscription.
Print-and-color for kids
Parents and homeschoolers print the blank version as a coloring sheet. Children color each county however they like and learn the map of California along the way.
Classroom ideas for the California blank map
A few activities that work from grade 4 through college:
- Give students 10 minutes to label as many counties as they can on the blank version, then grade with the labeled version.
- Group the counties by sub-region, climate or historical period and have students color them by a key.
- Have students draw one dot per million people in each county to see where people live.
- Each week, students put a sticker on the county where a news story happened.
- Plan a road trip across California and draw the route on the labeled version.
- Print the map twice, color one copy by income and the other by life expectancy, and compare the patterns.
How to print the California map
For most people the easiest path is the PDF. Pick the paper size (US Letter, A4, Tabloid, A3, A2 or A1), download it, open it in Acrobat or Preview and print with “Fit to page” or “Scale to fit”. The map fills the page.
For best print quality
Use the SVG: it is vector and stays sharp at any size. The PDF and PNG are raster images (the PDF holds a 2,400 px image), and raster images blur when printed larger than their pixel size allows.
For poster and large-format printing
Send the SVG to a print shop. A vector file has no fixed resolution, so the same file that prints sharply on letter paper prints sharply at 24 × 36 inches or larger. If the shop asks for a PDF, open the SVG in Inkscape or Illustrator and save it as a vector PDF.
For Word, Google Docs, and slide decks
Use the PNG, which you can download 1,200 to 7,200 px wide; 2,400 px suits most documents and slides. If your slide tool accepts SVG (PowerPoint and Keynote do), use the SVG so it stays sharp when projected.
All 58 counties of California
Each county is drawn as its own path, so you can style, label or extract it in Illustrator or Inkscape. For a sortable table with population, land area and median income for every county, see the California counties page.
- Alameda
- Alpine
- Amador
- Butte
- Calaveras
- Colusa
- Contra Costa
- Del Norte
- El Dorado
- Fresno
- Glenn
- Humboldt
- Imperial
- Inyo
- Kern
- Kings
- Lake
- Lassen
- Los Angeles
- Madera
- Marin
- Mariposa
- Mendocino
- Merced
- Modoc
- Mono
- Monterey
- Napa
- Nevada
- Orange
- Placer
- Plumas
- Riverside
- Sacramento
- San Benito
- San Bernardino
- San Diego
- San Francisco
- San Joaquin
- San Luis Obispo
- San Mateo
- Santa Barbara
- Santa Clara
- Santa Cruz
- Shasta
- Sierra
- Siskiyou
- Solano
- Sonoma
- Stanislaus
- Sutter
- Tehama
- Trinity
- Tulare
- Tuolumne
- Ventura
- Yolo
- Yuba
Neighboring states
License & attribution
The blank, labeled and colored maps on this page are dedicated to the public domain under Creative Commons CC0. You can copy, modify, distribute and use them, including for commercial purposes, without asking permission or giving credit. The city dots on the “with cities” map come from SimpleMaps’ free US ZIP data, released under CC BY 4.0: when you use that version, add the credit “City data: SimpleMaps (CC BY 4.0)”.
The underlying boundary geometry is itself public domain: the US Census Bureau’s 2017 cartographic boundary files, via the us-atlas project.
Glossary
- Blank map
- An outline map showing only the borders of regions, without any names, colors, or other markings.
- SVG
- Scalable Vector Graphics: a text-based format that describes shapes mathematically. SVG files scale to any size without losing quality.
- Choropleth
- A thematic map where each region is colored according to a data value (population, income, election results, etc.).
- TopoJSON
- An extension of GeoJSON that encodes shared borders only once, producing much smaller files. The source format we use to render these maps.
- Mercator projection
- A cylindrical map projection that preserves angles, used in most online maps. Distorts area near the poles but is familiar to most readers.
- Public domain
- A work that is not protected by copyright and can be used freely by anyone for any purpose, including commercially.